
Founder Decisions · Growth & Marketing
Yes, they can. But the problem is not necessarily inaccurate advertising software. It's that each report answers a different question. Meta might claim a purchase, Google might claim the same purchase, email might record the final click, and TikTok might call someone a new customer even though they bought from your Shopify store last year.
If you use those reports to divide next month's budget, you risk rewarding the channel that takes the most credit rather than the one that adds the most profit.
For a £1m–£20m ecommerce brand, the solution is an attribution audit that connects three things: the orders that actually happened, the customers you can identify, and the extra sales your marketing probably created. It won't deliver a perfect answer. It should make the uncertainty visible enough to stop you spending against imaginary growth.
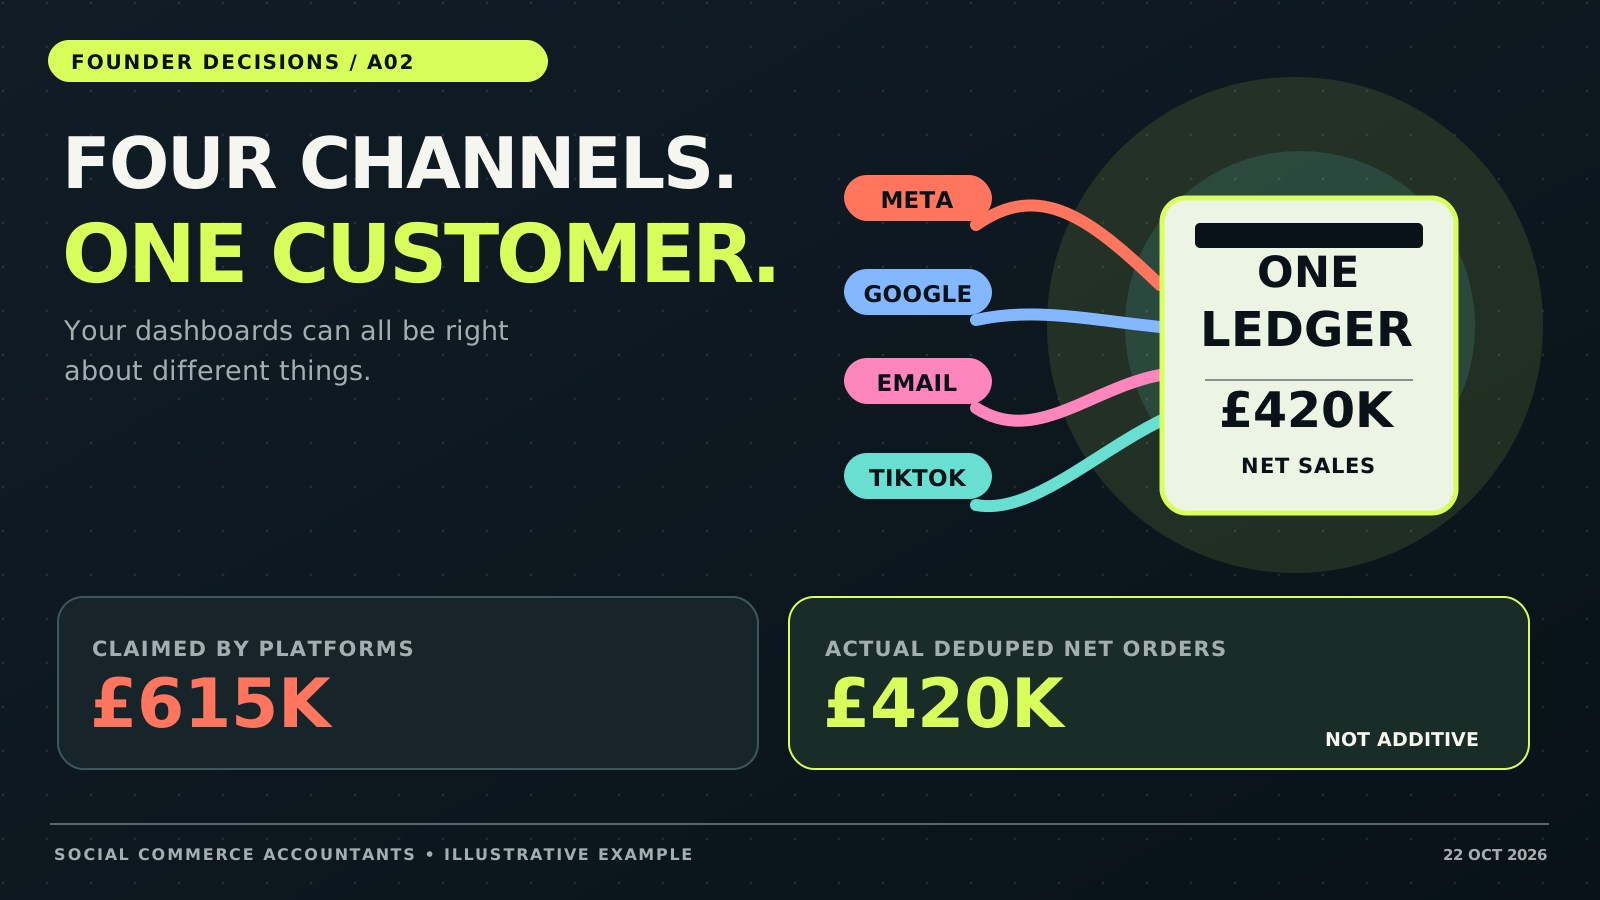
Illustrative one-month scenario: £615,000 of combined platform-attributed sales versus £420,000 of reconciled net order revenue, excluding VAT and after refunds. These measures cannot be added together.
Four dashboards claim £615k. Your orders say £420k.
Imagine a UK supplements and sportswear brand doing around £5m a year across Shopify, Amazon and TikTok Shop. In a particular month, its order ledger shows £420,000 of unique net sales excluding VAT, after the expected treatment of refunds. Its marketing reports show:
| Reporting source | Sales claimed |
|---|---|
| Meta | £260,000 |
| £180,000 | |
| £110,000 | |
| TikTok | £65,000 |
| Combined claims | £615,000 |
| Reconciled net order revenue | £420,000 |
All figures are illustrative, not SCA client results. The £615,000 of claims deliberately represents overlapping attribution reports; it is not a recognised sales figure.
The £195,000 difference is a warning, not a calculation of exactly how much revenue was double-counted. Reports may use different dates, attribution windows, VAT treatments, return adjustments or order definitions before you even get to overlapping credit. Shopify, for example, says returns aren't factored into its Campaigns report metrics. Shopify Campaigns definitions.
TikTok's own documentation explains that an advert for one product may receive credit when the shopper buys another product from the same shop. It does not claim the same order for multiple TikTok Shop ads, but that rule does not stop Google, Meta or email claiming part of the wider customer journey. TikTok Shop attribution guidance.
Start with one order-level truth: unique order ID, transaction date, gross customer payment, discounts, VAT, refunded value, net sales, landed product cost, fulfilment, platform and payment fees. Match marketplace settlements to orders, but never substitute cash payouts for sales.
Then create a separate view of the advertising claims. Keep both. Don't force attribution totals to equal the sales ledger by silently scaling them down; that manufactures certainty.
SCA's existing profitability-at-scale guide explains why blended return figures obscure margin. This audit answers the next question: when several channels claim the same growth, whose budget should change?
Stop dividing the budget according to who claimed the sale
Think of three different measurements.
Recorded sales are completed, deduplicated orders adjusted for VAT and refunds. They are the basis of your financial results.
Attributed sales are orders assigned credit under a particular platform's measurement rules. They help you manage campaigns, but several systems can claim influence over one order.
Incremental sales are sales that would not have happened without the advertising or activity being tested. That is the closest measure to the value of the decision.
Allocate additional budget on the evidence for incremental contribution, not the sum of channel claims:
Incremental profit from a campaign = additional net sales × contribution margin before that campaign − additional campaign costs.
Use channel- and basket-specific contribution margins wherever possible. Include landed cost, fulfilment, platform charges, returns and other variable selling costs; don't count recoverable VAT as income or cost. Include additional agency or creative expenditure if that spending changes with the decision.
The strongest evidence is usually a credible controlled test or holdout, followed by consistent cohort comparisons. Platform attribution remains useful for everyday optimisation, but it is weaker evidence of causation. Google describes Conversion Lift as measuring conversions driven by advertising beyond a control group; availability and eligibility vary by account and campaign. Google Conversion Lift.
This doesn't mean pausing every campaign. It means admitting when a report shows credit rather than lift.
Is branded Google search buying sales you would have won anyway?
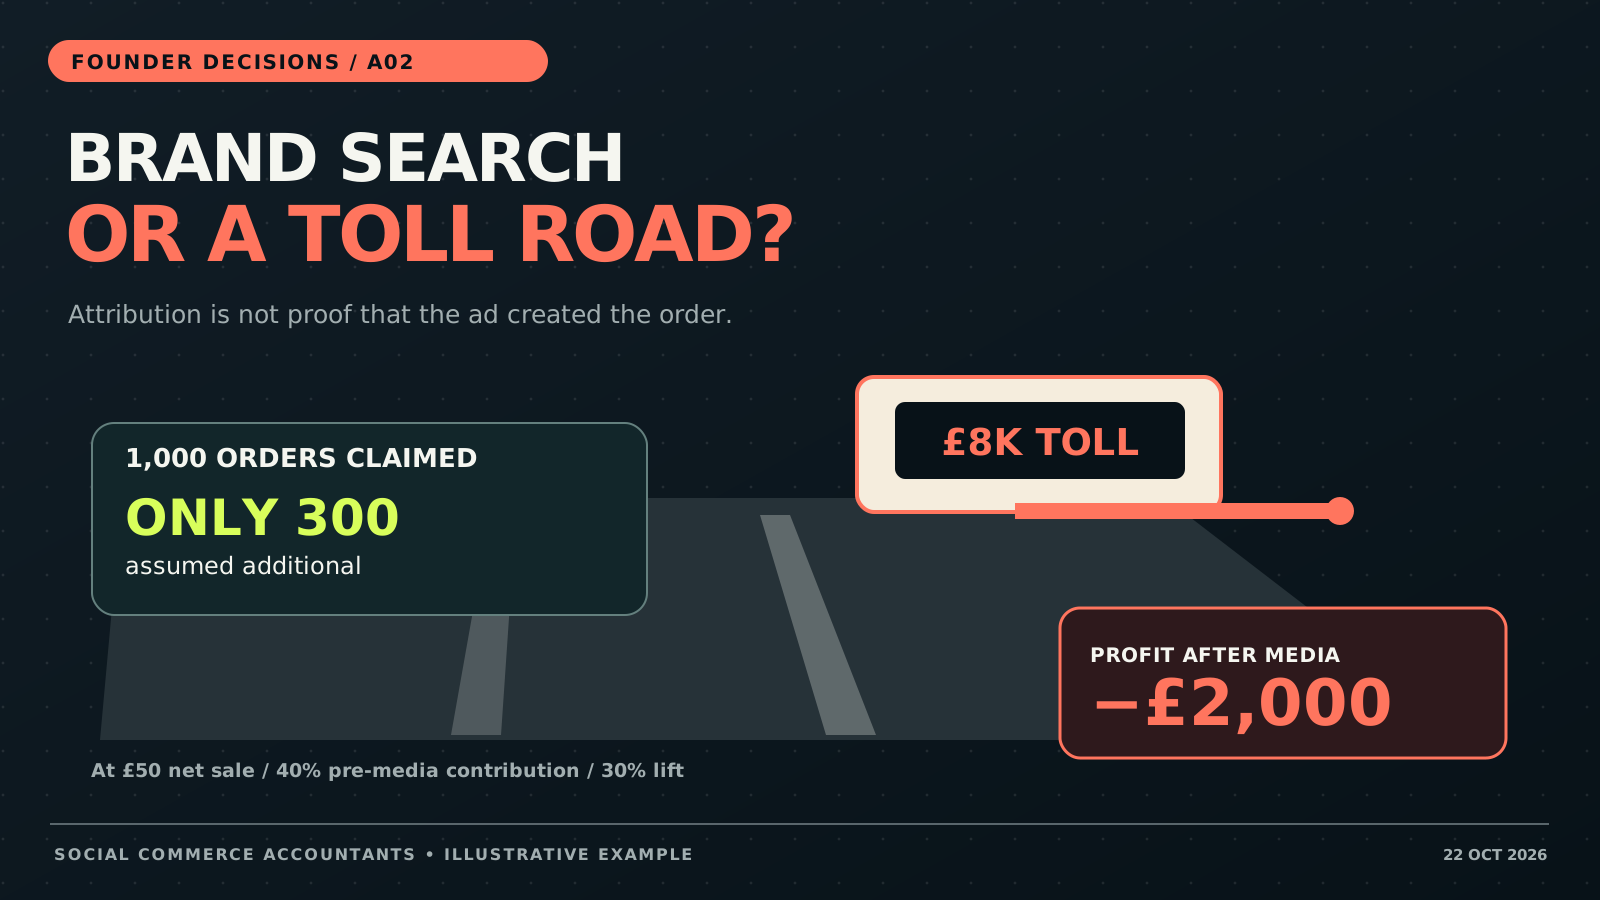
Suppose your brand spends £8,000 a month on adverts against its own name. Google credits those adverts with 1,000 orders. Each order is worth an illustrative £50 net of VAT, with a 40% contribution margin before media.
The credited orders have £20,000 of pre-media contribution. But if most customers would have clicked the organic listing or typed your website address anyway, that £20,000 isn't all incremental.
Assume a properly designed test suggests 30% of those orders were genuinely additional:
- Incremental orders: 1,000 × 30% = 300.
- Incremental pre-media contribution: 300 × £50 × 40% = £6,000.
- Incremental profit after branded-search media: £6,000 − £8,000 = −£2,000.
Under those assumptions, branded search isn't covering its own spending. The break-even incremental share is £8,000 ÷ (1,000 × £50 × 40%) = 40%.
That is not an instruction to switch off brand campaigns indiscriminately. Competitors might be bidding on your name, organic visibility might be weak on mobile, or paid search might protect high-value launches. Those effects belong in the test.
Compare matched places, audiences or time periods where the experimental design is credible. Measure combined paid and organic branded orders, not just the paid-search report, and monitor competitor activity and other campaigns. Google's brand settings can help isolate brand traffic in eligible Search and Performance Max campaign arrangements, though those settings are not themselves an incrementality study. Google branded traffic guidance.
A brand campaign that loses its own attributed conversions when paused may still be doing exactly what you suspected: letting organic search collect the orders instead. The business outcome decides whether the spending was worthwhile.
Your agency changed the attribution window. Did performance actually improve?
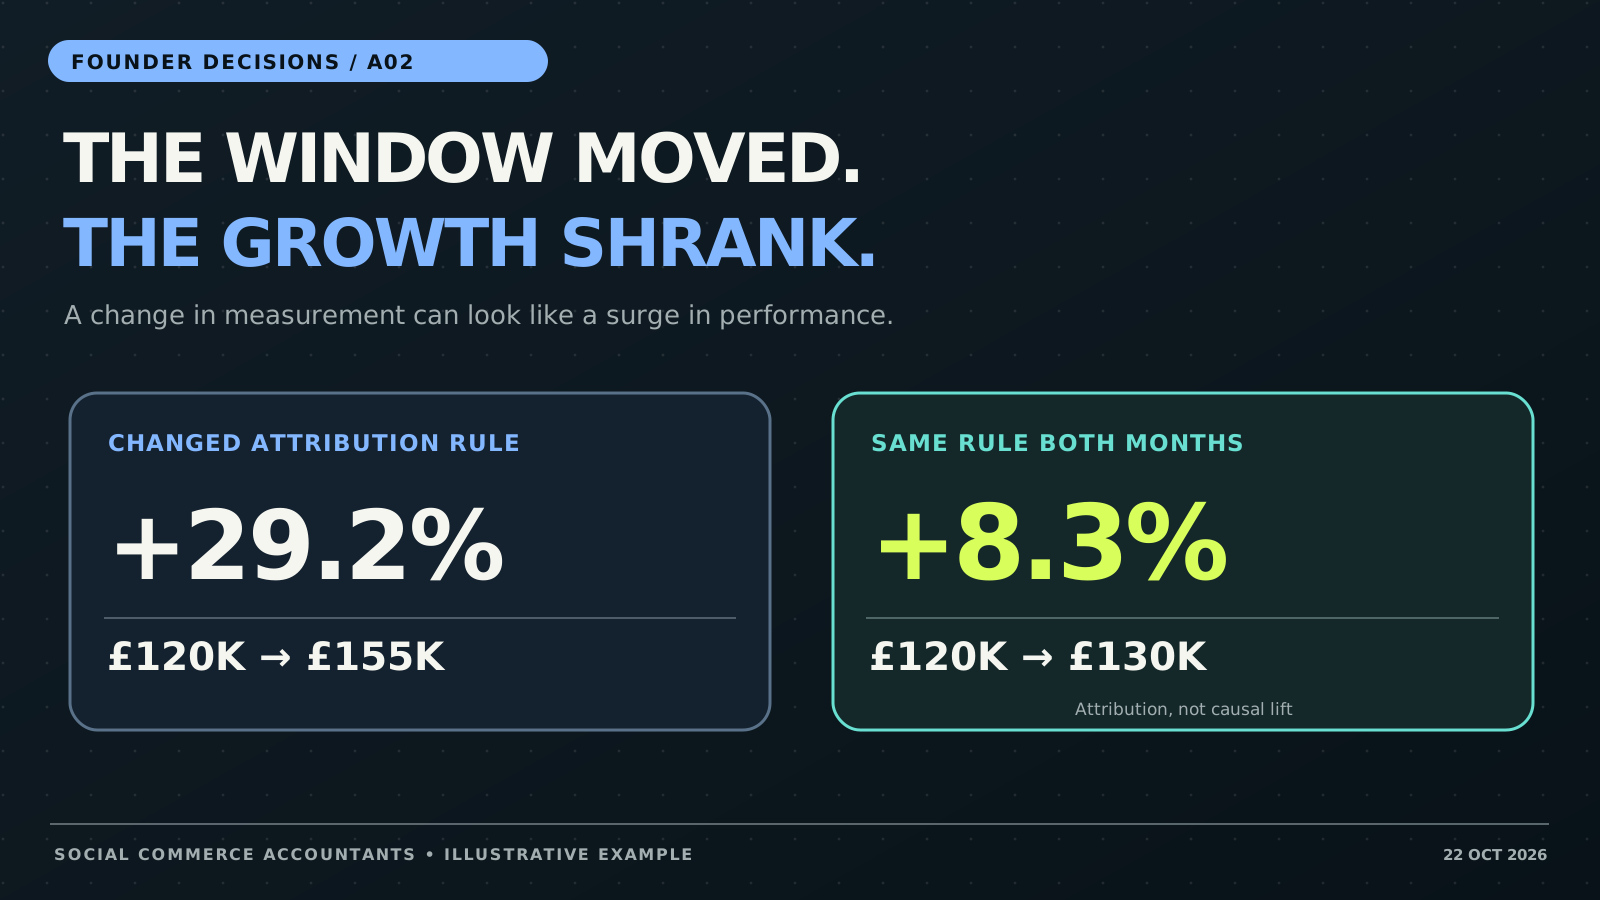
Imagine September was reported using a 7-day click and 1-day view rule, but October was reported using a more generous rule. October's attributed sales jump sharply.
You need October calculated on September's rules before you can call that an improvement.
| Basis | September | October | Apparent growth |
|---|---|---|---|
| Original reports, different rules | £120,000 | £155,000 | 29.2% |
| Comparable 7-day click / 1-day view | £120,000 | £130,000 | 8.3% |
Illustrative campaign-attributed values, not unique ledger sales or proven incremental growth. Figures rounded to one decimal percentage point.
The October difference between £155,000 and £130,000 is £25,000 of additional reported credit under the changed rule, not evidence of £25,000 more real sales. The underlying £130,000 still needs a business-outcome check.
A proper bridge fixes the conversion action, click/view window, event date versus ad-interaction date, currency, VAT treatment, returned orders and deduplication rule. Record changes in a dated measurement log.
Don't assume every platform can restate historical data. Google says conversion-window changes generally apply prospectively; you cannot assume that a report exported after the change has reconstructed missing historical conversions. Google conversion windows. Where raw event data is unavailable, use a clean comparable period after the change and flag earlier numbers as non-comparable.
Also don't confuse general TikTok Ads window options with TikTok Shop Ads. TikTok documents a 7-day click and 1-day view attribution arrangement for Shop Ads, with Seller Center and Ads Manager able to report the same order against different dates. TikTok Shop reporting definitions and Seller Center comparison.
A buyer can be new to TikTok Shop and already know your brand
Marketplace reports usually know their own order history better than they know your full cross-channel history. Someone buying through TikTok Shop for the first time might have bought from your Shopify site, through Amazon, or under another email address years ago.
Shopify's new-versus-returning reporting is based on customers' store order history, not a universal identity covering every marketplace where a brand trades. Shopify customer reports.
Suppose TikTok reports 300 first-time shop customers. After combining the permitted customer records and historical identifiers, you classify them like this:
| Classification | Buyers | Evidence |
|---|---|---|
| Known prior brand customers | 120 | A reliable match to an earlier purchase elsewhere |
| Provisionally new to the brand | 110 | No earlier purchase found within adequately covered records |
| Identity unresolved | 70 | Insufficient or conflicting matching information |
| Total first-time TikTok customers | 300 |
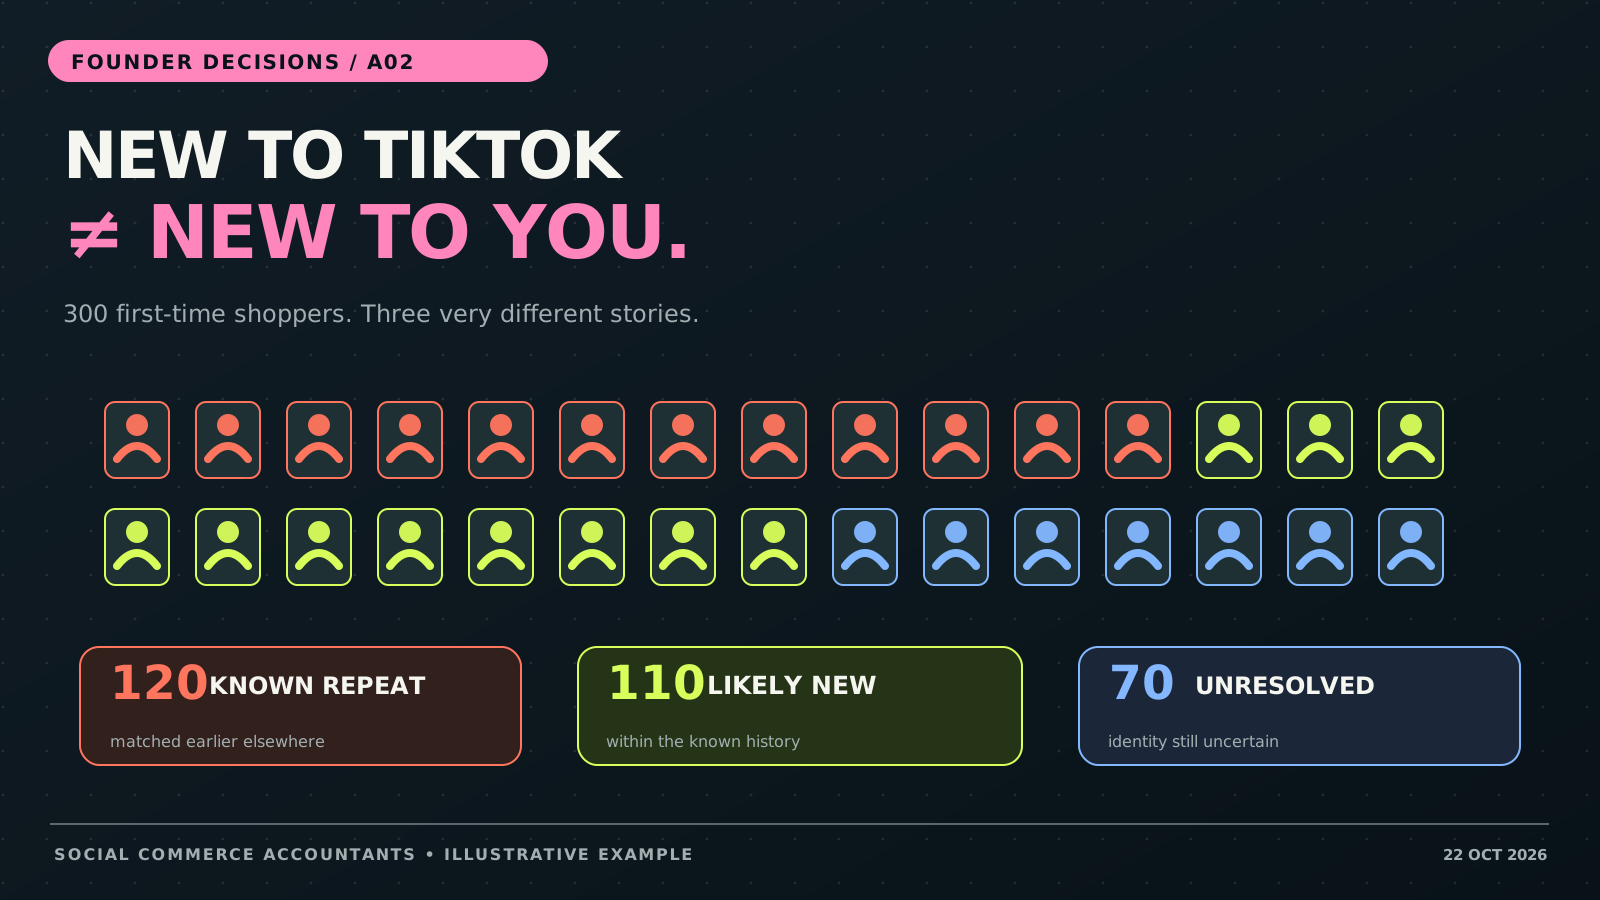
Under the stated matching assumptions, 110–180 is a useful provisional planning range for new-to-brand customers: 110 classified as new, plus up to 70 unresolved. It isn't a mathematically certain bound. Even apparently new identities can conceal older purchases outside the available lookback period or under another identity.
Keep the unresolved group separate rather than invent a definitive match. If the data permits, sample it using proportionate, lawful checks and report how much the answer moves. Customer matching is still personal-data processing: use a clear lawful basis, apply data minimisation and access controls, and don't assume hashing makes identifiers anonymous. ICO data-minimisation guidance.
One more distinction: new to the brand isn't the same as acquired by the campaign. Don't divide a paid campaign's spend by all 300 first-time TikTok buyers, or even the provisional 110–180 range, unless you've established those buyers are a relevant campaign cohort. Organic TikTok demand may be doing some of the work.
Why blended CAC can rise when both channels are unchanged
Suppose you compare two months. In each month, the business attributes 2,500 acquired customers exactly once across the two channels, under an unchanged assignment rule. Meta costs £30 per acquired customer and Google costs £10 in both months.
| Earlier month | Later month | |
|---|---|---|
| Meta acquired customers | 1,000 | 1,500 |
| Meta cost at £30 each | £30,000 | £45,000 |
| Google acquired customers | 1,500 | 1,000 |
| Google cost at £10 each | £15,000 | £10,000 |
| Total media | £45,000 | £55,000 |
| Total acquired customers | 2,500 | 2,500 |
| Blended media CAC | £18 | £22 |
Nothing became more expensive inside either channel. The business simply acquired more customers through the £30 channel and fewer through the £10 channel. The £4 rise in blended CAC is entirely a mix effect in this example.
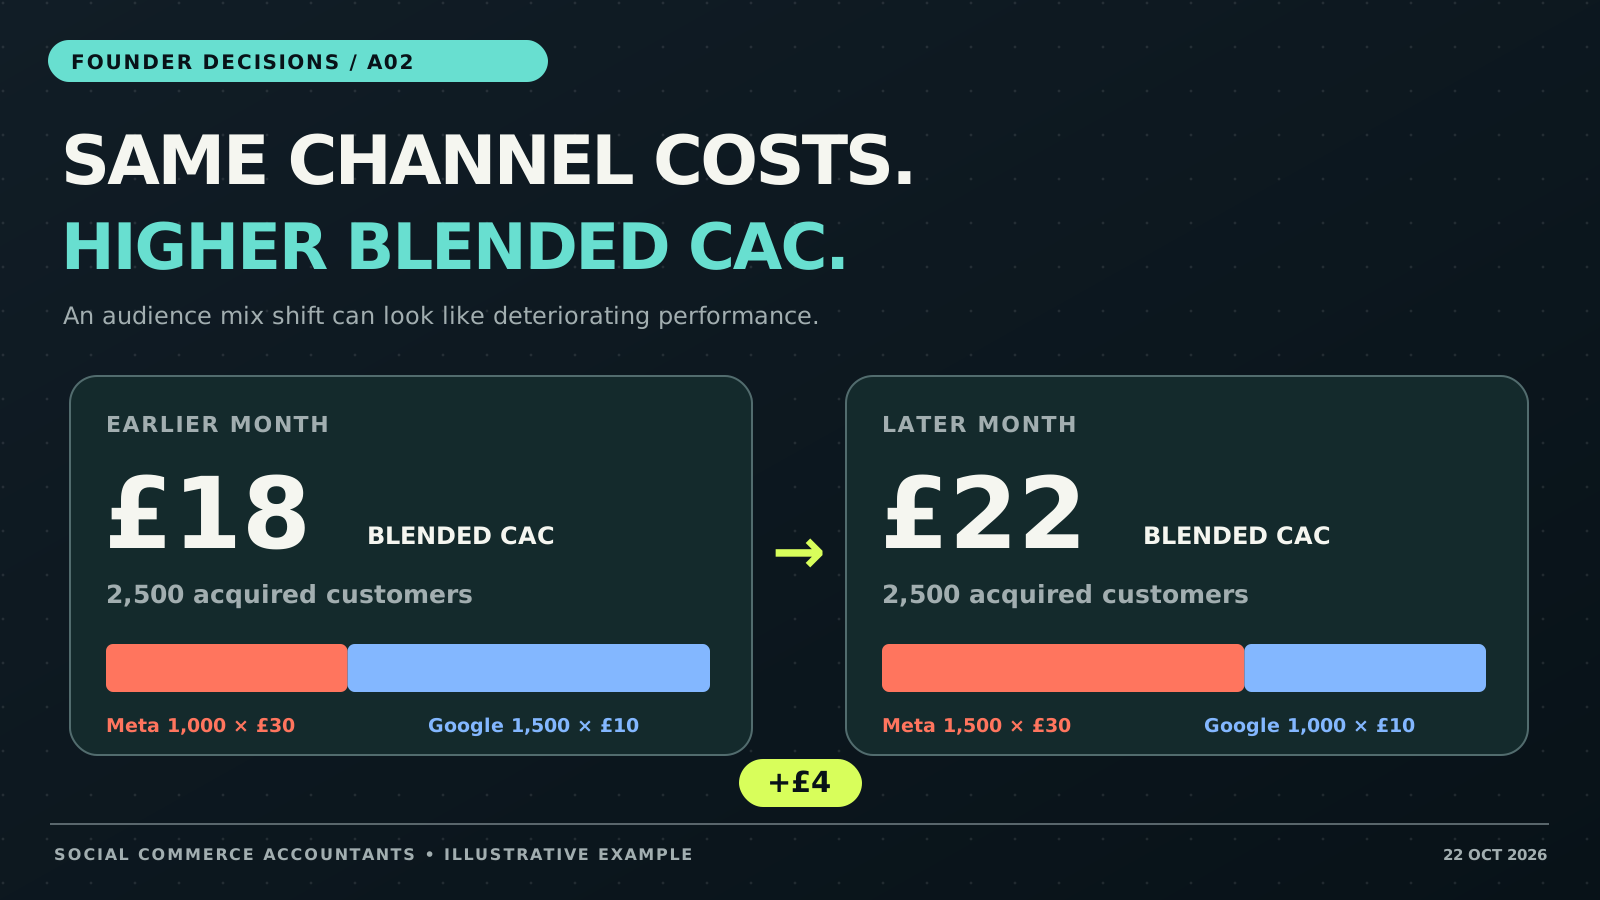
The useful diagnostic is to hold the earlier acquisition mix constant and calculate what the later rates would have produced. Here, later rates are unchanged, so the fixed-mix cost remains £18. The £4 gap comes from volume mix, not a deterioration in channel efficiency.
This matters because the response is different. A genuine deterioration might require creative or targeting changes. A mix change may be deliberate: perhaps the brand wants a younger audience, a different product category or better longer-term repeat purchasing.
But those benefits need testing. Media-only CAC also excludes production, agency fees and other acquisition overheads. Report a second, fully loaded CAC alongside it; don't compare one month's media-only figure with the next month's all-in figure.
Some customers take weeks to place their first order
A brand selling £300–£800 equipment may have a much longer research cycle than a brand selling a £20 impulse purchase. Judging the newest acquisition cohort against last month's fully matured results is unfair.
Suppose a campaign spends £30,000 to reach prospective first-time customers. The cohort accumulates attributed first purchases as the window matures:
| Cohort age | First purchasers recognised to date | Media cost per first purchaser |
|---|---|---|
| Same month | 160 | £187.50 |
| 30 days | 230 | £130.43 |
| 60 days | 280 | £107.14 |
Illustrative fixed £30,000 spend and accumulated, deduplicated first purchasers from one defined campaign cohort. Not a published benchmark or proof of incrementality.
A day-five CAC cannot be compared directly with a day-60 CAC. Compare different cohorts at the same age, using the same first-touch definition, channel assignment and conversion eligibility. State whether the dates refer to when someone clicked or when they purchased; Google explicitly offers conversion-time reporting because those views differ. Google conversion tracking data.
If your longest useful measurement window is shorter than the real buying cycle, use a longer-lived first-party cohort analysis alongside platform reporting. But don't quietly count every later sale as proof that an earlier advert caused it. Time lag and incrementality are separate problems.
A catalogue ad sells one product. The basket contains three.
A campaign promotes a particular product, but the shopper buys several things. Assigning the entire advertising cost to the promoted SKU can make that product look unprofitable while allowing the accompanying products to look artificially attractive.
TikTok's Shop Ads documentation specifically notes that attribution is tied to the Shop ID, not the product ID; a shopper can click an advert for one item and buy another. TikTok Shop attribution.
For internal reporting, choose a documented allocation method. Consider an illustrative mixed basket carrying £10 of associated advertising cost:
| Product A | Product B | Basket total | |
|---|---|---|---|
| Net revenue, ex VAT | £60 | £40 | £100 |
| Contribution before ads | £24 | £24 | £48 |
| Ad cost allocated by revenue | £6 | £4 | £10 |
| Contribution after revenue-based allocation | £18 | £20 | £38 |
| Ad cost allocated by pre-ad contribution | £5 | £5 | £10 |
| Contribution after contribution-based allocation | £19 | £19 | £38 |
Both methods preserve £38 for the basket. Neither demonstrates which SKU caused the purchase. Product profitability before advertising remains £24 and £24; the allocated cost is a management convention, not an observed causal property of either item.
If catalogue spend is substantial, test sensitivity to how the same spending is split between featured and accompanying products. Make buying and pricing decisions using product contribution before disputed ad allocations, plus relevant demand experiments where available.
How do you split a campaign that reaches new and returning customers?
Don't pretend the platform has cleanly separated audiences if it hasn't. Instead, publish a range tied to the quality of the underlying identity evidence.
Suppose £20,000 of media supports a campaign whose reliably classified response is 60% new-to-brand and 30% returning, with 10% unresolved. If the chosen reporting convention allocates spend in proportion to these responses:
| Reporting scenario | Acquisition | Retention | Unresolved |
|---|---|---|---|
| Keep the uncertainty visible | £12,000 | £6,000 | £2,000 |
| Assign all unknown response to acquisition | £14,000 | £6,000 | £0 |
| Assign all unknown response to retention | £12,000 | £8,000 | £0 |
Illustrative management-cost allocation, not a causal lift estimate. Acquisition therefore ranges from £12k to £14k and retention from £6k to £8k; the two upper bounds cannot happen simultaneously.
A campaign reaching existing customers could still influence new demand through word of mouth, and a nominal acquisition campaign may reactivate lapsed buyers. Where important, use customer holdouts or experiments to estimate the incremental effect on each group.
Keep shared creative, platform fees and fixed agency costs visible. Some are reasonably attributable to one purpose; others should remain in a shared marketing line rather than be allocated with spurious precision. SCA's existing creator commission pricing guide shows how a variable selling cost affects contribution; this allocation question is about how to treat marketing investment that serves more than one purpose.
What a founder should ask before signing off the next budget
A useful monthly marketing-to-finance meeting starts with the reconciled net sales and new-customer cohorts, not screenshots from four dashboards. It should leave you with a version-controlled attribution audit showing what the business sold, what each platform claims, which definitions changed, what's genuinely known about customer identity, and where incremental profit is supported by evidence.
If one channel wants an extra £20,000, ask what the expected additional contribution is under a downside, central and upside case. If the answer changes entirely depending on how unresolved identities are assigned, test that sensitivity before increasing the spend. If branded search claims to have protected demand, look for evidence in total branded sales, not solely its reported ROAS.
You don't need perfect customer-level tracking. You need a decision system that distinguishes sales, attribution, acquisition and causation. Otherwise the same order can appear to fund four separate marketing budgets.
Social Commerce Accountants' work on channel-level P&Ls for supplement brands is the starting point for reliable contribution reporting. For founders assessing future acquisition spend alongside stock and cash commitments, the SCA × RT Finance fractional CFO service explains its scenario and cash-flow modelling approach.
The lesson: don't ask which platform reported the most sales. Ask which spending decision is most likely to create additional profitable customers — and how confident you are in that answer.